One of my main tasks is to keep a close eye on performance. Every time we have a major release, I have to start looking at performance, find main culprits and fix them. Well, not me, but work with developers and find a solution to the issues at hand. And our databases are rather large, historical databases are in the terabytes, current databases are in the hundreds of gigs, if not terabytes as well, few of them.
Statistically (in my work), partition elimination in all its flavors (aggregating partitioned tables, etc) is one of the recurring patterns in the offending queries I found over the past few months. Actually, it’s the lack of it :). Now, what’s so special about it? Well, it helps keep I/O down to an acceptable level by not reading more data pages than we actually need. In fact, there are few other complementary methods, like proper WHERE clauses (SARGable WHERE clauses, etc) which can be pushed down by the query optimizer and so on and so forth.
Working on a query few weeks ago, I came across a scenario where partition elimination could not be easily used. The task at hand was to get the MAX value of a column without being able to filter it in ant way. Similar to this one:
SET @variable = CONVERT(NVARCHAR(100), SELECT MAX([column1]) FROM dbo.Table1 WITH (NOLOCK)))
Apart from the obvious issues with the above statement, the MAX value was retrieved alright, but the problem was that it had to scan the whole table (couldn’t add any WHERE clauses to it). The fact that the table was partitioned on a datetime column, made me think of ways of getting somehow the partition boundaries and use partition elimination. [Column1] was an integer value which only increases, so my initial thought was, of course, that the MAX value would be in the last ones inserted. Table was also one of the biggest we have in that database, was heavily read from and written into and due to some constraints, I wasn’t able to add any index that would help.
My first attempt was to limit the search to only few days worth of data. There was an improvement, it read far less records (39K opposed to 43 millions), it scanned only the last few partitions, but business rules made this approach not feasible.
SELECT @variable = MAX([Column1]) FROM dbo.Table1 WHERE [DateTimeColumn] >= @CutoffDate
So how would I go through all the table without being so expensive ? One way would be the direct way, using the WHERE clause which would contain the required criteria. But that was already deemed unfeasible. And then there’s an indirect way, which has a limited applicability, but it’s a beautiful trick especially when the direct way is a bit difficult to achieve (like in my example). I learned this from a colleague of mine, Octavian Vaida (Thank you, Tavi), and because I find it really interesting, I decided to share it.
So, let’s set up the test environment. For the sake of experimentation, I’ve swapped the columns from my work query and I decided to see if the same applies when I’ll try to get the MAX of a DATETIME column on a table partitioned on an BIGINT column.
First we create a database and then the required objects: one partition function and 2 partition schemes (one for data and one for indexes).
IF EXISTS (SELECT 1
           FROM sys.databases
           WHERE [name] = 'Test'
)
BEGIN
    DROP DATABASE [Test]
END
GO

CREATE DATABASE [Test]
The script that creates the PF and PSs was generated by this (Generate_PFs_and_PSs.sql) script and certain sections of the script have been removed, as are not relevant for our case. Feel free to download it (you’ll have to rename it from .DOC to .SQL or .TXT), use it, change it, improve it.
USE [Test]
GO

/*
Creating partitioning objects for [test_part_elim] table:
PF          : pf_bigint_left_test_part_elim
PF datatype : bigint
PF type     : left
Data PS     : ps_primary_test_part_elim_data
Index PS    : ps_primary_test_part_elim_index
Data FG     : primary
Index FG    : primary
*/

/* Cleanup phase */
PRINT 'Cleaning phase - dropping existing objects'
IF EXISTS(SELECT 1 FROM [sys].[partition_schemes] WHERE [name] = 'ps_primary_test_part_elim_data')
BEGIN
    DROP PARTITION SCHEME [ps_primary_test_part_elim_data]
    PRINT '  ** [ps_primary_test_part_elim_data] partition scheme dropped'
END

IF EXISTS(SELECT 1 FROM [sys].[partition_schemes] WHERE [name] = 'ps_primary_test_part_elim_index')
BEGIN
    DROP PARTITION SCHEME [ps_primary_test_part_elim_index]
    PRINT '  ** [ps_primary_test_part_elim_index] partition scheme dropped'
END

IF EXISTS(SELECT 1 FROM [sys].[partition_functions] WHERE [name] = 'pf_bigint_left_test_part_elim')
BEGIN
    DROP PARTITION FUNCTION [pf_bigint_left_test_part_elim]
    PRINT '  ** [pf_bigint_left_test_part_elim] partition function dropped'
END

/* Create PF and PSs */
PRINT '(Re-)Creating objects...'
PRINT '  * Adding partition function'
IF NOT EXISTS(SELECT 1 FROM [sys].[partition_functions] WHERE [name] = 'pf_bigint_left_test_part_elim')
BEGIN
    CREATE PARTITION FUNCTION [pf_bigint_left_test_part_elim](bigint) AS RANGE left FOR VALUES
    (    0,  10000,  20000,  30000,  40000,  50000,
     60000,  70000,  80000,  90000, 100000, 110000,
    120000, 130000, 140000, 150000, 160000, 170000,
    180000, 190000, 200000, 210000, 220000, 230000,
    240000, 250000, 260000, 270000, 280000, 290000,
    300000, 310000, 320000, 330000, 340000, 350000,
    360000, 370000, 380000, 390000, 400000, 410000,
    420000, 430000, 440000, 450000, 460000, 470000,
    480000, 490000, 500000, 510000, 520000, 530000,
    540000, 550000, 560000, 570000, 580000, 590000,
    600000, 610000, 620000, 630000, 640000, 650000,
    660000, 670000, 680000, 690000, 700000, 710000,
    720000, 730000, 740000, 750000, 760000, 770000,
    780000, 790000, 800000, 810000, 820000, 830000,
    840000, 850000, 860000, 870000, 880000, 890000,
    900000, 910000, 920000, 930000, 940000, 950000,
    960000, 970000, 980000, 990000,1000000,1010000,
   1020000,1030000,1040000,1050000
    )
    PRINT '  ** [pf_bigint_left_test_part_elim] partition function created'
END

PRINT '  * Adding data partition scheme'
IF NOT EXISTS(SELECT 1 FROM [sys].[partition_schemes] WHERE [name] = 'ps_primary_test_part_elim_data')
BEGIN
    CREATE PARTITION SCHEME [ps_primary_test_part_elim_data] AS PARTITION [pf_bigint_left_test_part_elim]
    ALL TO (    [PRIMARY]    )
    PRINT '  ** [ps_primary_test_part_elim_data] partition scheme created'
END

PRINT '  * Adding index partition scheme'
IF NOT EXISTS(SELECT 1 FROM [sys].[partition_schemes] WHERE [name] = 'ps_primary_test_part_elim_index')
BEGIN
    CREATE PARTITION SCHEME [ps_primary_test_part_elim_index] AS PARTITION [pf_bigint_left_test_part_elim]
    ALL TO  (    [PRIMARY]    )
    PRINT '  ** [ps_primary_test_part_elim_index] partition scheme created'
END
And now, let’s create the table:
USE [Test]
GO

CREATE TABLE [test_part_elim]
(    c1    BIGINT IDENTITY(1,1),
     c2    INT    NOT NULL DEFAULT( CEILING(RAND()*1000)),
     c3    VARCHAR(100) NOT NULL DEFAULT('ABC'),
     c4    DATETIME NOT NULL DEFAULT(GETDATE())
)
ON [ps_primary_test_part_elim_data](c1)

CREATE CLUSTERED INDEX [ix_c1] ON [test_part_elim]([c1])
WITH
(   SORT_IN_TEMPDB = ON,
    ONLINE = ON,
    ALLOW_ROW_LOCKS = ON,
    ALLOW_PAGE_LOCKS = ON
)
ON [ps_primary_test_part_elim_data](c1)

CREATE NONCLUSTERED INDEX [ix_c2] ON [test_part_elim]([c2],[c1])
WITH
(   SORT_IN_TEMPDB = ON,
    ONLINE = ON,
    ALLOW_ROW_LOCKS = ON,
    ALLOW_PAGE_LOCKS = ON
)
ON [ps_primary_test_part_elim_index]([c1])
Second, we populated the tables.
INSERT INTO [test_part_elim]([c2],[c3],[c4])
VALUES (DEFAULT, DEFAULT, DEFAULT)
GO 1050000
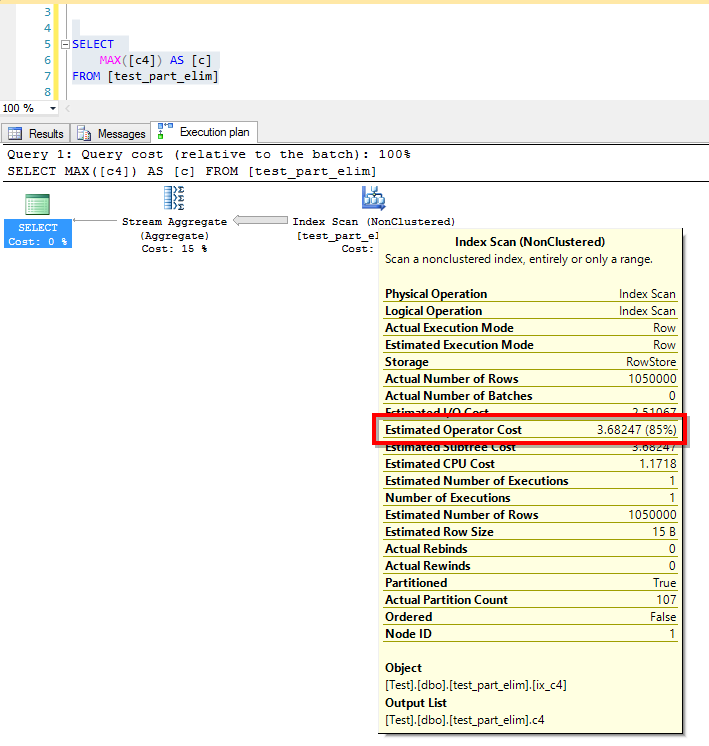
Third, we start testing. Let’s assume we want to get the MAX of [c4] (which is datetime) and it’s not the partitioning column. One way of doing it is:
SELECT
    MAX([c4]) AS [c]
FROM [test_part_elim]
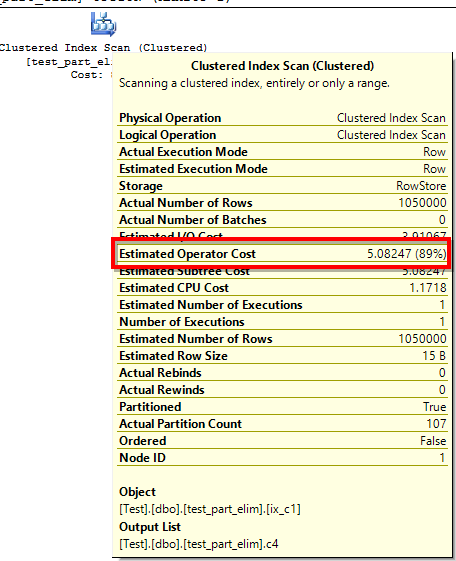
But the execution plan doesn’t look so good. When dealing with large tables, clustered index scans are never good. The index scan operator cost is close to the subtree cost. The I/O statistics shows these numbers:
(1 row(s) affected)
Table 'test_part_elim'. Scan count 107, logical reads 5145, physical reads 0, read-ahead reads 0, lob logical reads 0, lob physical reads 0, lob read-ahead reads 0.

(1 row(s) affected)
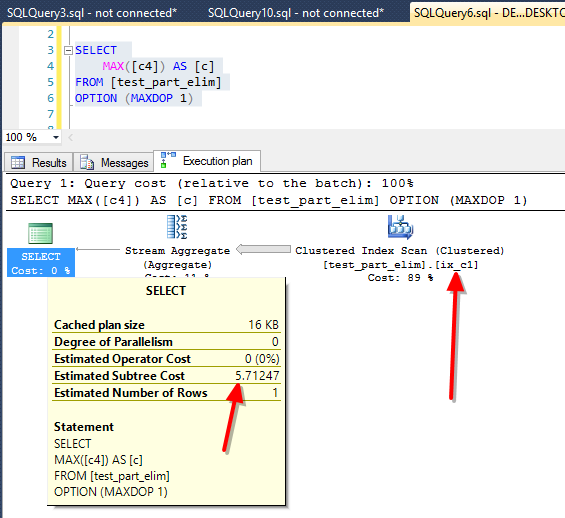
Let’s test the same but with MAXDOP 1.
SELECT
    MAX([c4]) AS [c]
FROM [test_part_elim]
OPTION (MAXDOP 1)
The execution plan doesn’t look any better. Same clustered index scan, same range of costs. If we look at the subtree cost for the whole statement, it shows a cost of 5.71247. The operator cost is, again, close to this value. The I/O for the serial plan is the same:
(1 row(s) affected)
Table 'test_part_elim'. Scan count 107, logical reads 5145, physical reads 0, read-ahead reads 0, lob logical reads 0, lob physical reads 0, lob read-ahead reads 0.
(1 row(s) affected)
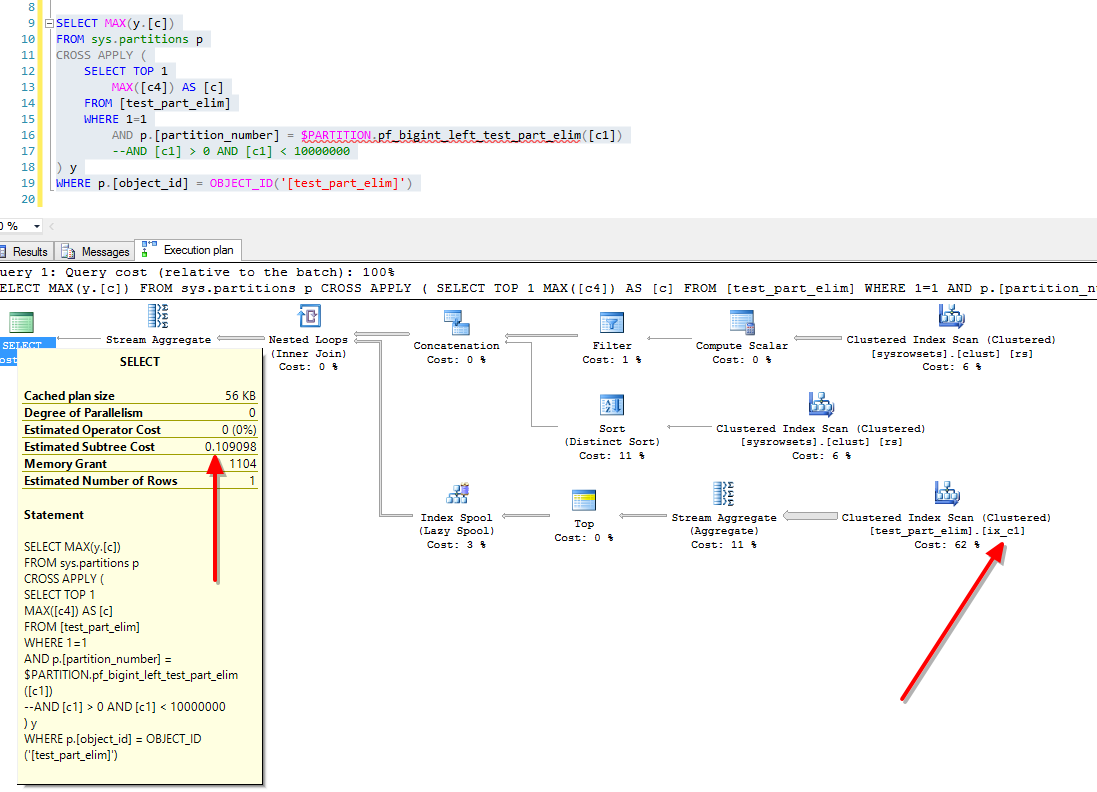
But what if we consider the partitions as smaller tables, that can be scanned individually ? Let’s try this approach to get the MAX value we need:
SELECT
    MAX(y.[c])
FROM sys.partitions p
CROSS APPLY ( SELECT TOP 1
                  MAX([c4]) AS [c]
              FROM [test_part_elim]
              WHERE p.[partition_number] = $PARTITION.pf_bigint_left_test_part_elim([c1])
            ) y
WHERE p.[object_id] = OBJECT_ID('[test_part_elim]')
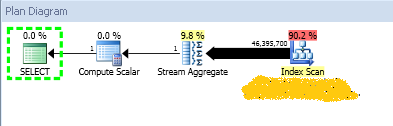
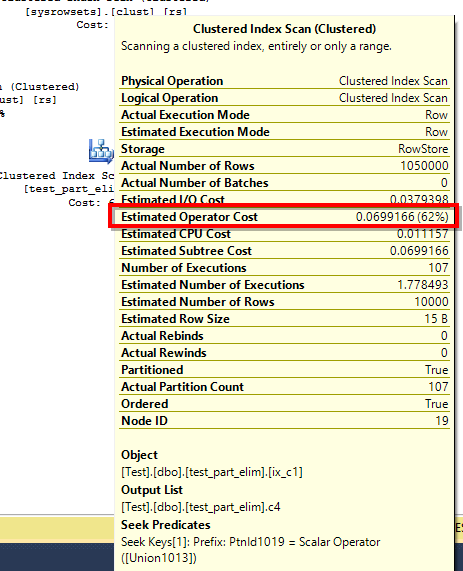
For starters, the execution plan looks totally different. If we’re examining the execution plan, we’ll see that the subtree cost is now 0.109098. That’s a dramatic change in cost, even though the script scans all 106 partitions in both cases. The operator cost also dropped considerably.
Warning: Null value is eliminated by an aggregate or other SET operation.

(1 row(s) affected)
Table 'Worktable'. Scan count 428, logical reads 1281, physical reads 0, read-ahead reads 0, lob logical reads 0, lob physical reads 0, lob read-ahead reads 0.
Table 'test_part_elim'. Scan count 107, logical reads 5145, physical reads 0, read-ahead reads 0, lob logical reads 0, lob physical reads 0, lob read-ahead reads 0.
Table 'sysrowsets'. Scan count 2, logical reads 14, physical reads 0, read-ahead reads 0, lob logical reads 0, lob physical reads 0, lob read-ahead reads 0.

(1 row(s) affected)
Some may argument that the costs we’re seeing would drop if we would have a covering index in place. So, what if we create a covering index for column [c4], will the query have a lower cost with the second approach ? One way to find out… Let’s create an index first.
CREATE NONCLUSTERED INDEX [ix_c4] ON [test_part_elim]([c4],[c1])
WITH
	(	SORT_IN_TEMPDB = ON,
		ONLINE = ON,
		ALLOW_ROW_LOCKS = ON,
		ALLOW_PAGE_LOCKS = ON
	)
ON [ps_primary_test_part_elim_index]([c1])
And let’s see what’s happening with the queries. First thing I noticed, is that the new index is being used.
With script 1, we have these I/O figures.
(1 row(s) affected)
Table 'test_part_elim'. Scan count 107, logical reads 3255, physical reads 0, read-ahead reads 0, lob logical reads 0, lob physical reads 0, lob read-ahead reads 0.

(1 row(s) affected)
The logical reads have dropped by approximately 30%.. Execution plan looks a bit different (we’re not having a parallel plan because of the new index), subtree cost have dropped a bit from 5.71247 down to 4.31247 and operator cost dropped as well, from 5.08247 down to 3.68247. It’s good, but let’s see the second approach.
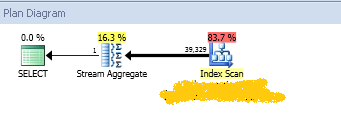
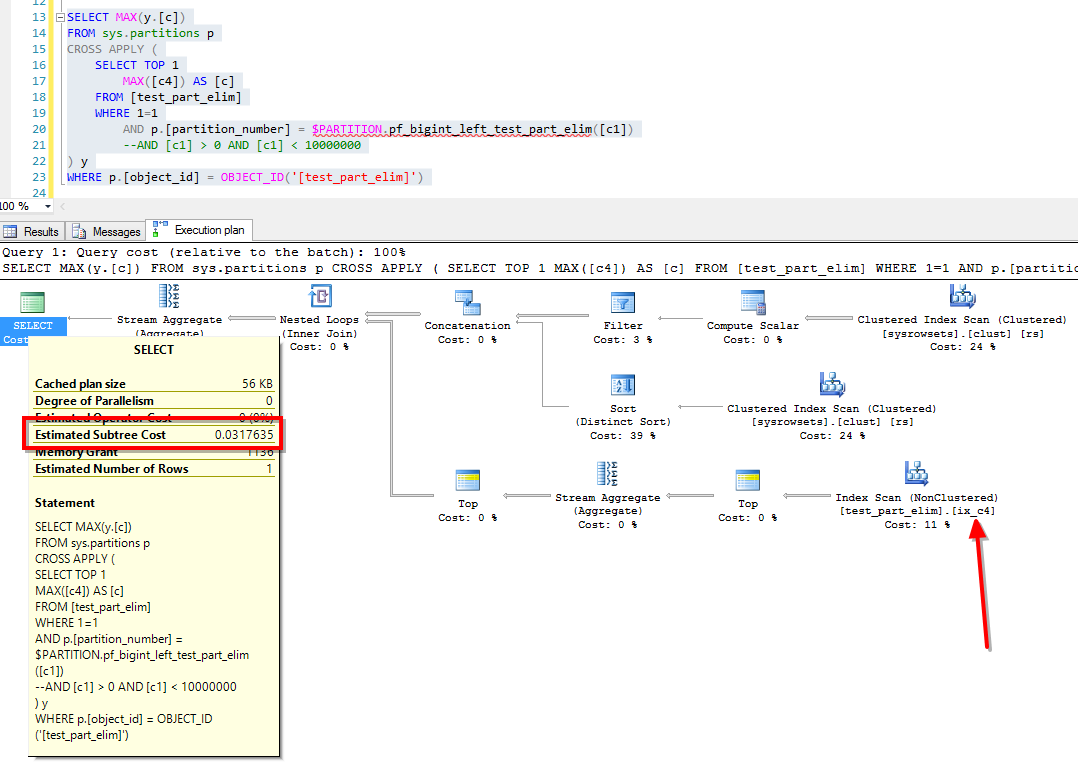
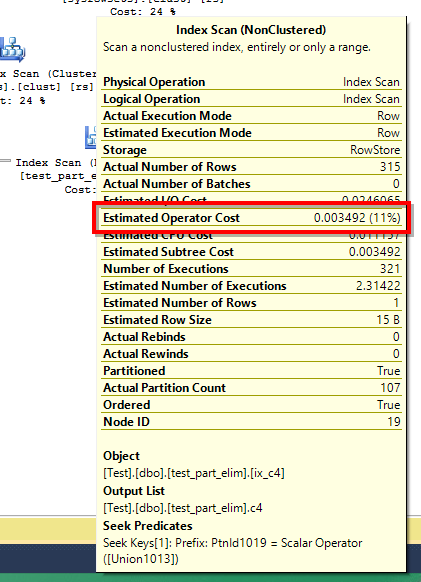
With script 2, the I/O looks way better, with only close to 12% from the whole reads previously.
Warning: Null value is eliminated by an aggregate or other SET operation.

(1 row(s) affected)
Table 'test_part_elim'. Scan count 321, logical reads 630, physical reads 0, read-ahead reads 0, lob logical reads 0, lob physical reads 0, lob read-ahead reads 0.
Table 'sysrowsets'. Scan count 2, logical reads 16, physical reads 0, read-ahead reads 0, lob logical reads 0, lob physical reads 0, lob read-ahead reads 0.

(1 row(s) affected)
The execution plan looks similar but check that subtree cost and index scan operator cost!
We can go even further with our tests, by adding a WHERE clause, on one of the non-partitioned columns, maybe even on the same C4 we’re reading. To not make this post too long, let me just say that during my tests, the same improvement pattern has been seen when using WHERE clauses.
Here are 2 scripts I’ve used to test. In the execution plans, check the subtree costs and index scan operator costs and do the math yourself.
SELECT
	MAX([c4]) AS [c]
FROM [test_part_elim]
WHERE
	[c1] > 0 AND [c1] < 10000000


SELECT MAX(y.[c])
FROM sys.partitions p
CROSS APPLY (
	SELECT TOP 1
		MAX([c4]) AS [c]
	FROM [test_part_elim]
	WHERE 1=1
		AND p.[partition_number] = $PARTITION.pf_bigint_left_test_part_elim([c1])
		AND [c1] > 0 AND [c1] < 10000000
) y
WHERE p.[object_id] = OBJECT_ID('[test_part_elim]')


SELECT
	MAX([c4]) AS [c]
FROM [test_part_elim]
WHERE
	[c4] > DATEADD(DAY, -5, GETDATE())

SELECT MAX(y.[c])
FROM sys.partitions p
CROSS APPLY (
	SELECT TOP 1
		MAX([c4]) AS [c]
	FROM [test_part_elim]
	WHERE 1=1
		AND p.[partition_number] = $PARTITION.pf_bigint_left_test_part_elim([c1])
		AND [c4] > DATEADD(DAY, -5, GETDATE())
) y
WHERE p.[object_id] = OBJECT_ID('[test_part_elim]')
To summarize, we have the following subtree and operator costs:

And how do we explain this ?
With method one, we’re scanning all records in all partitions in one go (with or without parallelism) and this is how we’re getting the max value. With method 2, we’re getting one MAX value for each partition and then a MAX across these MAX values is calculated. This explains why the cost dropped so considerably.
Enjoy.
