Hello again.
You all probably heard here and there that separating data from the indexes is good. Some of you even went down that road and actually did it. Which is good.
There are also a ton of articles on this topic and the ones that come quickly to my mind are the ones authored by Paul Randal (here, here and here). These are not the only ones, most likely.
I will try not to repeat what others already said as to why. I will, however, try to show you why.
Here’s the setup. There’ll be 2 tests. One for a one-filegroup database (PRIMARY) and one with a 3-filegroup database (PRIMARY, DATA and INDEX). To enhance a bit the results I’ve placed the databases on 2 USB sticks. The TLOG was placed on the local drive, to avoid skewing the results with the I/O related to that.
The test itself will have the following steps:
- create the db and the tables
- populate the tables
- start PerfMon
- run random scripts (well, pseudo-random :), you’ll see )
- cleanup
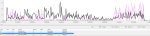
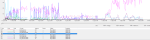
While doing the above, I’ll use a simple PerfMon session to capture the disks response times.
So let’s get started. We’ll create 3 tables, same schema for all 3. We’ll populate each table and then run some scripts against them. You can download the scripts here. You might want to adjust the paths, the sizes of the files. In the scripts that populates the tables, you can change the number of the records inserted by changing the number of the batches (GO 5000).
To run the scripts, I’ve used the SQLQueryStress (oldie, but goldie – available here). The stored procedure I’ve used, generates a list of scripts from a given folder (see the code) and based on a randomly generated number, executes one of the scripts. Depending on the number of scripts, you might want to adjust the module operand (in my case, 12 as I have 12 scripts). Please also note that the stored procedure called by the SQLQueryStress is using xp_cmdshell. Make sure this is enabled before running it. Or, if this is an issue, feel free to change the code to use Powershell, for example. Alternatively, you can adjust the whole process to be a dynamic code stored in temp table of some sort (copy and paste the workload scripts in an VARCHAR(MAX) column).
And now let’s see the results. Before anything else, briefly, the setup:
- One FG: TLOG located on local drive and PRIMARY FG located on F: (USB stick)
- MultiFG: TLOG and PRIMARY FG located on local drive, DATA located on F (USB stick) and INDEX on H (also an USB stick)
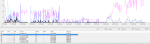
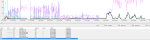
Here’s a summary of the PerfMon data (file can be downloaded here).

Looking at the figures above, it is clear that having multiple FGs definitely helps. The average response times (Avg Disk Sec / Read and Avg Disk Sec / Write) improves considerably. The read response time improved with more than 100%, the write response time improved with more than 200% on the F drive. As there’s no data in the one filegroup case for H drive, there’s no data to compare against. The max response times also improves, as it can be seen in the highlighted cells.
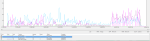
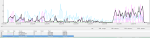
All the PerfMon graphs can be seen here, as a gallery:


Considering that my setup was a rather simple one, in a real life scenario where things can get complicated really ugly, this approach can help improving the performance big time. Of course, as always, it is a matter of “it depends”, but as a rule of thumb, if the table is going to be hammered pretty heavy, maybe it makes sense to split the data from the indexes. Maybe having its own filegroup will help even more (here some other factors will need to be taken into account like table size, usage pattern, expected fragmentation, etc). Placing these on a LUN or on a storage that’s not so hammered may further help balancing out the I/O. I will not go any further into this, as there are a lot of other articles on the matter (see the 3 links from the beginning of this post, for example).
So next time you have to design the physical design of a database, think twice before just running the CREATE DATABASE statement or just blindly using the default options. This approach can also be used when troubleshooting performance issues. One thing that should always be checked is the underlying physical design of the affected tables.
What could be done differently to test this more thoroughly ? Well, one could use a server-side trace (SST) as well and correlate the 2 traces (PerfMon and SST) in SQL Profiler. This way you can also see the impact of each test script in terms of response times. Extended events can also be used to track the activity, but cannot be correlated in Profiler that nicely as an SST (or at least I am not aware of such a feature).
In addition to all of the above, sys.dm_io_virtual_stats can also be queried and see the impact from inside SQL Server on the affected files. Just make sure to query it in a loop, as the result set is cumulative.
Another thing that can be done differently (and this is something that you can try out), is to try and simulate workloads separately. First only reads, then only writes and then combined. This will allow you to see the improvement for each of the I/O pattern.
Another interesting thing to watch is the change in the I/O graphs when the tables are populated. But I’ll let you discover that for yourselves.
Enjoy.
